Hello everyone, today we will be looking into the JavaScript code that generates this cool looking visualization of a Lorenz system. It is based on a set of simple equations that produces incredible fractal spirals first discovered by Edward Lorenz in 1963! If you’ve ever heard of the “butterfly effect”, that phrase originates from these equations and other work by Lorenz.
c.width|=X=Y=Z=1
for(i=4010;i--;i<2e3&&x.lineTo(960+(X*C(t)-Y*S(t))*45,1160-Z*23))Z+=(X*Y-Z)/39,X+=(Y-X)/13,Y+=X*(28-Z)/99
x.fill('evenodd')
I have to thank Rodrigo Siqueira for getting me interested in exploring Lorenz systems. This dweet is in fact a remix of his code! You can check out more of his work on dwitter. Here’s the the image produced by his code, a perfect example of what a Lorenz system normally looks like. It actually kind of resembles a butterfly while exemplifying the chaotic implications of the butterfly effect.
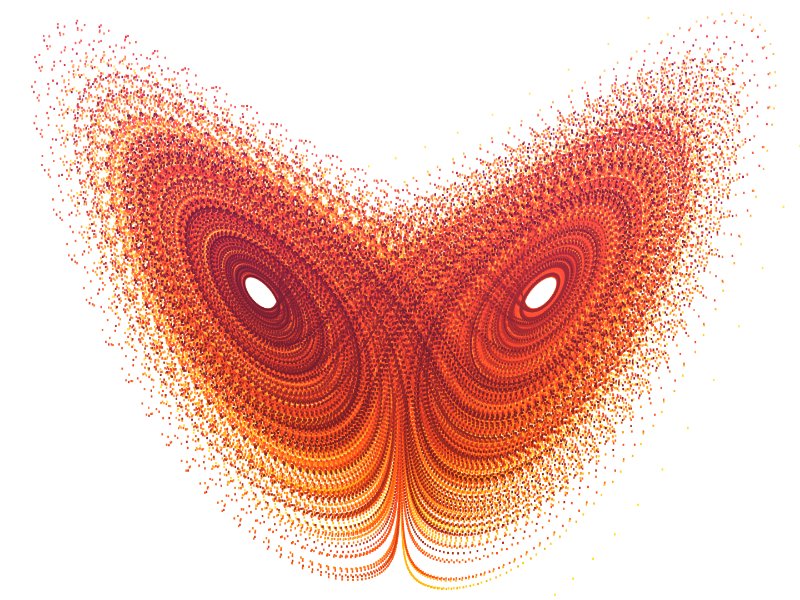
A Lorenz attractor is a 3 dimensional system that exhibits chaotic properties for certain parameters and initial conditions. It is known as a strange attractor because it attracts points into a loop with a fractal like structure. The system is composed of three differential equations…
- dx/dt = ( y – x ) * a
- dy/dt = ( b – z ) * x – y
- dz/dt = x * y – c * z
These equations describe how to change a 3D coordinate system with respect to dt (change in time), where a, b, and c are constants. To get the delta for each coordinate we can multiply both sides by dt. The code for this dweet is little more than an application of these equations. Here is the dweet running live in an embedded iframe. Feel free to play around the code with it while we dissect it!
We will begin by reformatting the code so it is easier to understand. I just added some white space and moved a few things around to make it flow better. Here’s a link to open this code in my custom JavaScript live editor CapJS. While it is nice to be able to play with the code in the iframe, it is a little more user friendly to open it up in a new window, preferably on your second monitor.
c.width|=X=Y=Z=1                   // clear canvas and init vars
for( i=4010; i--; )                // for loop
  X += (Y-X) /13,                  // ( y - x ) * a * dt
  Y += (28-Z)*X /99,               // ( b - z ) * x * dt
  Z += (X*Y-Z) /39,                // ( x * y - c * z ) * dt
  i<2e3 &&                         // warm up before drawing
    x.lineTo(                      // plot a point
      960+ ( X*C(t)-Y*S(t) ) *45,  // apply X/Y rotation
      1160- Z*23 )                 // flip Z upside down
x.fill('evenodd')                  // evenodd fill
Alright, now that the code is a bit less scary we can talk about how each line works.
c.width|=X=Y=Z=1
First we must clear the canvas c (created by dwitter) by using the |= operator on the canvas width. This little trick has the added bonus of clearing our path from the previous frame, so a call to beginPath() is not necessary.
In conjunction with clearing the canvas/path we also initialize the starting point to (1,1,1). This has a small side effect of changing the width to 1921 because it starts as 1920 and gets ored with 1. It’s not really a problem with a value of just one pixel though and is essentially unnoticeable.
for( i=4010; i--; )
Here we are setting up the loop. The constants 4010 along with 2e3 (2000) were carefully chosen to use start and end points that are close together so there is no seam visible in the final render. Because of the chaotic nature of the system, these constants were found by stepping through starting values of i until I found a close enough match.
As with most dweets, we will be defining the loop body by combining statements with the comma operator rather a {} block like you normally see. Skipping the curly brackets saves one character of space and every bit counts!
X += (Y-X) /13,                  // ( y - x ) * a * dt
Y += (28-Z)*X /99,               // ( b - z ) * x * dt
Z += (X*Y-Z) /39,                // ( x * y - c * z ) * dt
This is where we apply the Lorenz equations. They may look familiar to what we saw earlier but also a bit different. There are a few changes and simplifications, let’s walk through them.
The first thing you will notice is the dt (delta time) value has been combined with the constants to save space. The change in time, or dt, must be very small for the system to appear smooth and curvy. We can figure out from the Y equation that dt is equal to 1/99. You can use this to work out the values of the other constants if you are into that sort of thing.
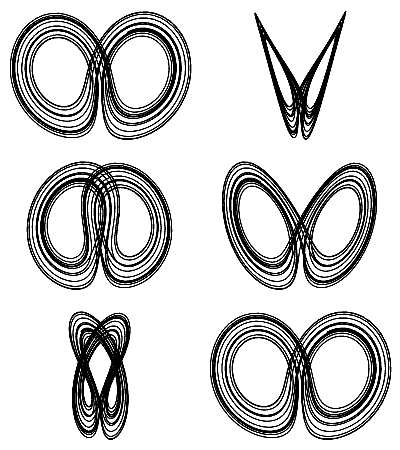
The only fundamental change is removing the -Y part of the equation for dy. I noticed while playing around that removing this made it look a bit lopsided which I thought was even cooler looking, plus it saves two characters. It is kind of surprising, but that that term isn’t really necessary for the attractor to do it’s thing!
The animation to the right shows what it would look like if it had the -Y part. As you can see it is more symmetric but maybe a bit less interesting to look at.
i<2e3 &&
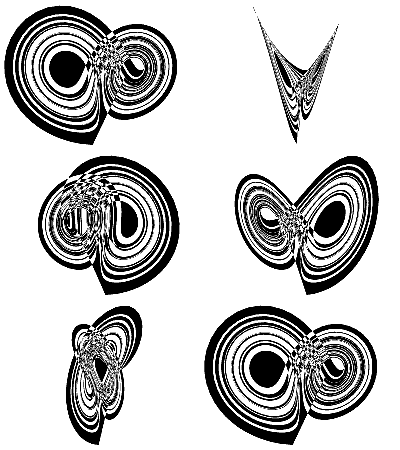
This part works like an if test to prevent the rest of the line from being executed while i is less then 2000. This effectively “warms up” the system. For those first 2000 iterations the values will be pulled from their starting point at (1,1,1) fully into the loop of the attractor.
The animation to the left shows what it would look like without this test applied. You can see a line cutting across from the starting point at the bottom to the ending point. That’s why it is so important for the start and end point to match up. It takes a few loops to get into the groove.
x.lineTo(
For each point we will add it to the path to by calling lineTo on our canvasContext x created dwitter.
960+ ( X*C(t)-Y*S(t) ) *45,
Now that we have the point’s position we need to do a slight transform on it to apply the rotation and frame it on the canvas.
The canvas is 1920 pixels tall so we offset by half that (960) to center it on the x axis.

To create a rotating 3D effect, we pass time t to the trig functions cosine C and sine S and scale the X and Y coordinates. You can use this simple method to animate rotation for any 3 axis system, in this case rotating around the Z axis. To stretch the shape on the canvas we apply a scale of 45.
Of course, the Lorenz equations are 3D so we could rotate around any axis. For example the animation to the right shows what it would look like rotating around the Y axis.
1160- Z*23 )
For Y axis, we use the Z coordinate to orient the shape vertically as Lorenz attractors are most often viewed. I also flipped it upside down because I thought it looked a bit better that way.
The canvas is 1080 pixels high so to roughly frame the shape we scale the Z coordinate by 23 and subtract from 1160. Most numbers like this are just found by tweaking things until it looks right.
x.fill('evenodd')
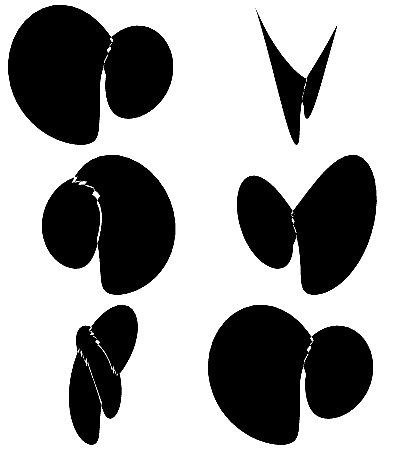
After the loop has finished and all the points are plotted we can draw the shape. Calling fill by itself wouldn’t look very good though. The animation to the left shows what a normal fill would look like. It kind of kills the whole vibe, right?
Another option is to draw using stroke, but the line is a bit thin without enough space to set the lineWidth. Instead we will use the amazing evenodd fill mode. This setting alternates between drawing and not drawing every time the line crosses over itself.
The evenodd fill mode is one of the most powerful tricks in the tiny JavaScript code toobox and has many different uses. For this dweet it is helping to give some weight and structure to our visualization.
A new trick I have since learned is that any time there are quotes directly inside parens with nothing else like (‘evenodd’) it can be written as `evenodd` using a string literal to eliminate the parens and save 2 precious characters.
Let’s take one last look at the code for our dweet, now down to only 138 bytes with that last trick I mentioned. Hopefully it makes a little more sense to you now…
c.width|=X=Y=Z=1
for(i=4010;i--;i<2e3&&x.lineTo(960+(X*C(t)-Y*S(t))*45,1160-Z*23))Z+=(X*Y-Z)/39,X+=(Y-X)/13,Y+=X*(28-Z)/99
x.fill`evenodd`
That brings us to the end of another dissection. I hope you enjoyed this one and learned something new! Go ahead and play around with the code, try some experiments, that’s the best way to learn. To help get you started I just created a new dweet that implements the exact same Lorenz system descried in the Wikipedia article.
I will leave you with an answer to the age old question “what happens when you throw a square into a Lorenz attractor”. Please share on twitter if you liked this post. Thanks for reading, see you next time!


Awesome!
Congratulations, you literally wrote one of the best posts I’ve seen in forever. If your blog isn’t already taking off, it definitely will if you keep sharing posts like this one.
Pingback: 2019 – Year In Review – Adventures in Tiny Coding | Killed By A Pixel