The dweet we will be looking at today may be the simplest one so far, but it’s every bit as mesmerizing and uses a neat trick to plot polar coordinates. There is plenty of room for playing around with the code to create cool remixes and loading style animations. Continue reading on for a full explanation of how it works!
c.width|=c.style.background="#CDF";for(j=3e3;j--;x.arc(960,540,430+60*S(j/500+a*4)*(S(a-t)/2+.5)**9,a,a))a=j/159+t,x.lineWidth=29
x.stroke()

The idea for this piece comes from Dave Whyte aka beesandbombs, his work has inspired many dweets and is worth checking out. Here’s a link to his original design “Circle wave.”
One of my favorite things about working with tiny programs is the live editing. When I was working in the games industry it would sometimes take over 10 minutes to get a code change into the game. It feels amazing to type code and see instant feedback without needing to recompile or even refresh. Here’s the code for this dweet running live, feel free to play around with it while we go over how it works.
Our first step is to reformat the code so it’s easier to read. I’ve just added some white space and moved the x.arc to the end of the for loop. Here’s a link to open this code in my personal JavaScript editor, CapJS. I recently hooked up CodeMirror and I’m loving all the features it has!
c.width|= c.style.background="#CDF"         // clear light blue
for( j=3e3; j--; )                          // for loop head
  a = j/159 +t,                             // angle
  x.arc( 960, 540,                          // center circle
   430+ 60* S(j/500+a*4)* (S(a-t)/2+.5)**9, // radius / waves
   a, a )                                   // angle
x.lineWidth = 29                            // line width
x.stroke()                                  // draw the line
Now the structure of the program is a bit easier to understand. The general plan is we will use arc to plot polar coordinates around a circle with some waviness to create the shape. Let’s go through it one line at a time…
c.width|= c.style.background="#CDF"

This line clears the canvas background color to light blue.
The c.width|= part clears the canvas c by making JavaScript think that the canvas width has changed. Because it is doing a bitwise or against a function definition, the width will not be changed. This is a technique used often on dwitter.
The rest of the line sets the background style for the canvas to “#CDF” which is a light blue color. This is a nice way to set the background color without using fillStyle.
for( j=3e3; j--; )
Here is our standard for loop. The 3e3 (scientific notation for 3*10^3=3000) controls how many points we will use to form the ring. This is essentially the resolution of our wave and can be increased at the expense of processing time. I chose 3e3 to make the ring seem as smooth as possible while keeping a high framerate.
a = j/159 +t,
Before plotting the wave, we need to calculate the angle around the circle for this sample and store it in a. The j/159 part determines how much to rotate around the loop for each iteration. This wave rotates around exactly 3 times, so that’s 3e3/(3*2*PI) which rounds out to 159.
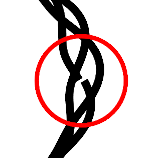
The +t (time) part does not control the wave, it’s purpose is to hide the seam (start and end) of our stroke by keeping on away from the wavy part. The image to the left shows where the breakage would occur without adding t.
The glitch is very small in this case, an unintended side effect of the circle looping around 3 times, because 3 happens to be very close to PI. Depending on how the numbers are tweaked, the seam could be much more or much less apparent.
x.arc( 960, 540,
The arc command is typically used to render circles, but here it will be used to plot polar coordinates. Another way to do this would be to use sine and cosine to convert to polar coordinates but arc saves some space and simplifies the code by doing the transformation for us.
We will be calling arc on our canvas context x in a special way to plot only a single point with each call rather then an entire circle. The first step is to center the polar coordinate system on our 1920 x 1080 canvas which is (960, 540).
430+ 60* S(j/500+a*4)* (S(a-t)/2+.5)**9,
Alright, buckle up. This line is the real meat of the dweet. It is here that we will calculate the distance for our polar coordinate which creates the wave shape.
The 430+ is the radius of our circle which we will perturb slightly with the following math to make the waves appear. Our canvas is 1080 pixels high so a circle of radius 430 fits it snugly inside.
The wavy part is built using sine waves which go from -1 to 1, so the 60* scales the amplitude of the wave to a reasonable size. This means our maximum radius will be 430 + 60 = 490 pixels.
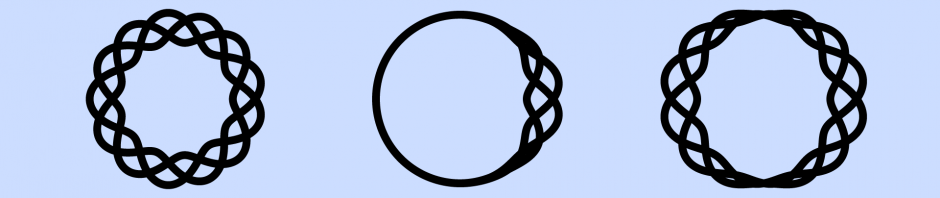
The wavy part is actually composed of 2 waves. One with a short wavelength that weaves around the circle and one with a much longer wave length that creates the bubble. The animation to the right shows both waves separated with the longer one in red. The end result will be both of these waves multiplied together.
The short waves are created by S(j/500+a*4). Though I didn’t realize at the time the 500 is actually wrong! I wanted to make it wrap around exactly 3 times which should be 3e3/(2*PI) which is about 477. That is a better way to hide the seam without needing to add +t.
The animation on the left shows just the short wave by itself. You might notice the small glitch circling around which is normally hidden.
The a*4 controls the short wave’s wavelength. A high multiple makes more waves that are shorter and a lower multiple makes less waves that are longer. The animation to the right shows what it would look like with a*2, double the wavelength. For this one I also replaced the j/500 with j/477 to show how much better it looks without the seam.
The (S(a-t)/2+.5) part is how we allow only some of the short waves to bubble out. Taking the sign of our angle will create a wave that wraps exactly once around the circle. Adding t makes it rotate around the outside.
The sine wave output is -1 to 1 so we can divide by 2 and add .5 to shift the sine wave to the 0-1 range. The animation to the left shows what it would look like without normalizing the output of sine. It creates 2 bubbles with peeks where the output of sin is -1 and 1. To get more bumps we could increase the angle’s scale, for example S(3*a-t) makes a 6 sided shape.
To compress the bubble to a tighter space we take the result to a high power by putting **9 after it. Lower values will cause the bubble part to be larger.
a, a )
To plot a single point with arc, we just use the same angle for both the start and end.
x.lineWidth = 29
To get a thick line we need to set the width because it is only 1 pixel wide by default.
x.stroke()
Now that the shape has been built, all that is left to do is render it using the stroke command. This will draw a line connecting all the points we’ve just added to the path using arc.
That’s pretty much explains the whole dweet! Let’s take one last look at our code with some improvements. We can save 2 bytes by removing the +t and using j/477 to properly hide the seam. I also used another trick that I didn’t mention above where the loop condition is a=j–/159, saving another 2 bytes. This brings the total size down to 136 bytes from the original 140. Maybe you can think of a way to make it even smaller?
c.width|=c.style.background="#CDF"
for(j=3e3;a=j--/159;x.arc(960,540,430+60*S(j/477+a*4)*(S(a-t)/2+.5)**9,a,a))x.lineWidth=29
x.stroke()
I encourage you to play around with the code and experiment. Try to come up with something new and post it on dwitter as remix to my dweet. If you want to make it into a looping gif, add t*=Math.PI/3 to the top and it will loop every 6 seconds.
I will leave you with an animation of a cool remix I made with only a few tweaks. See if you can figure out how it works. Please share on twitter if you liked this post. I hope you learned something new, thanks for reading!


Pingback: 2019 – Year In Review – Adventures in Tiny Coding | Killed By A Pixel